Unlock Strategic Communication with a Colorful Infographic Illustration Set
Data overload is a common strategic obstacle. Whether you're presenting quarterly results to stakeholders, explaining a complex process to your team, or trying to capture a customer's attention in a crowded market, raw numbers and dense text often fail to convey meaning. The thoughtful use of visual communication is not merely decorative; it is a critical tool for clarity, persuasion, and retention. This is where a professionally designed Colorful Infographic Illustration Set becomes a strategic asset. It provides a cohesive visual framework to transform abstract data into compelling narratives.
The Strategic Value of a Cohesive Visual Toolkit
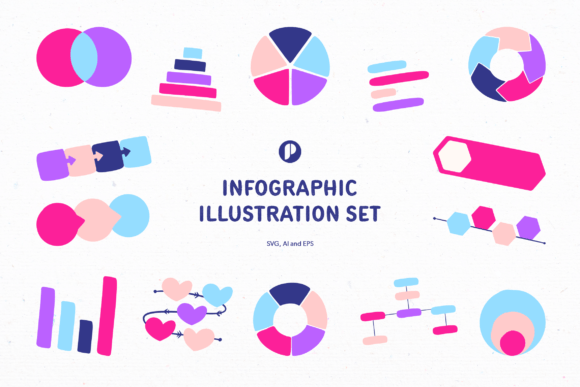
A collection of 20 illustrations—including flow charts, timelines, pie charts, and mind maps—in formats like AI, SVG, and EPS offers more than just convenience. It provides a consistent visual language. For entrepreneurs, marketers, and educators, consistency builds credibility and aids comprehension. When your audience sees the same cosmic blues, pinks, and purples across your presentations, reports, and social media, they begin to associate that palette with your brand's voice. This subtle reinforcement strengthens brand identity and makes complex information feel familiar and approachable.
Using a pre-designed set also addresses a practical constraint: time. Creators and freelancers often need to produce high-quality visual content under tight deadlines. Starting from a blank canvas for every project drains resources. A versatile Colorful Infographic Illustration Set serves as a foundational library. You can resize, duplicate, and adapt elements to fit the context, ensuring your primary effort focuses on strategic messaging rather than basic illustration.
Aligning Visuals with Clear Communication Goals
Before applying any illustration, the critical first step is to define your communication objective. Are you aiming to inform, persuade, or instruct? A timeline from the set is excellent for showing project evolution or company history, building trust through transparency. A pyramid chart might be perfect for explaining a hierarchical value proposition or a tiered service offering. The gauge chart can effectively visualize progress towards a goal, making performance metrics instantly understandable for teams or clients.
Consider your audience's needs. A detailed mind map diagram may engage educators and learners exploring interconnected concepts, while a simple label list with bright icons could be the optimal choice for a busy small business owner scanning key product features. The set's variety allows you to match the illustration type to the cognitive load you wish to impose. The goal is always to reduce friction in understanding.
Planning for Integration: Beyond Decoration
Treat these illustrations as integral components of your content strategy, not just as final-step decorations. In your planning phase, identify the data points or process steps that are most likely to cause confusion. These are your visualization priorities. For instance, when drafting a new operational procedure, you might plan to use the flow chart illustrations from the Colorful Infographic Illustration Set to map the workflow from the outset, ensuring the text and visuals are developed in tandem.
For long-term projects, such as a multi-phase marketing campaign or a curriculum, you can plan to use specific chart types consistently across chapters or stages. This creates a visual rhythm that helps audiences track progression. The strategic reuse of these assets across different mediums—a blog post, a webinar slide deck, and an internal memo—amplifies your message while maximizing the return on your design investment.
Risks of Random Application and How to Avoid Them
The primary risk of using any visual asset, including this illustration set, without clear intent is miscommunication. A colorful pie chart placed arbitrarily can distract from the main narrative or even misrepresent data relationships. Similarly, overusing bright colors on every slide can overwhelm rather than guide. The key is intentional selection.
Ask yourself: Does this illustration clarify or simplify the adjacent information? Does its style (the supple, neat scratches and pastel palette) suit the tone of my project—is it professional, innovative, or approachable? Avoid using illustrations merely to fill white space. Each inclusion should serve a purpose: to highlight a key figure, to summarize a list, or to visualize a sequence. This disciplined approach ensures your visuals enhance your authority and the content's usefulness.
Practical Applications Across Professional Roles
For the marketer, these illustrations can turn a dry market analysis into an engaging social media carousel, highlighting trends with timeline and bar chart graphics. The consistent color scheme aids in building campaign recognizability.
The educator or trainer can use the mind map and diagram elements to break down complex subjects, aiding memory and participation. Visual aids created from a unified set also make learning materials appear more polished and reliable.
Entrepreneurs and small business owners can leverage the set to create clearer investor pitches, using pyramid charts to show business models or gauge charts to illustrate milestones achieved. In operations, simplified flowcharts can improve internal process documentation, reducing training time and errors.
For the blogger or publisher, integrating these illustrations into long-form articles or e-books increases shareability and reader engagement. Visual summaries of key points help readers scan and retain information, improving the practical value of your content.
Making Tactical Decisions on Format and Scale
The availability of vector formats (AI, SVG, EPS) in this Colorful Infographic Illustration Set is a tactical advantage. Vector graphics can be resized infinitely without quality loss. This means you can use the same pie chart illustration on a business card icon, a full-page report, and a website banner, maintaining perfect clarity. Decide based on your output medium: use SVG for web projects for faster loading, EPS for high-quality print collateral, and AI for deep customization within Adobe software.
Consider also the scale of use. Duplicating and modifying elements within the set allows you to create extended visual sequences without design dissonance. For a multi-step tutorial, you could duplicate and slightly alter a process flow illustration for each step, creating a cohesive yet distinct series. This approach supports complex storytelling while keeping production efficient.
Building Long-Term Value through Visual Consistency
Strategic use of a unified illustration set compounds value over time. As you build a library of presentations, documents, and marketing materials all featuring the same visual DNA, you establish a professional and recognizable identity. This consistency signals reliability and attention to detail to clients, employees, and partners. It reduces the cognitive effort required for your audience to engage with new material from you, as they are already familiar with your visual language.
Furthermore, investing in a versatile set like this Colorful Infographic Illustration Set future-proofs your design capabilities. As new projects arise—a new product launch, an annual report, a training module—you have the core visual components ready. This enables you to respond quickly and maintain quality standards, supporting agility in your operations or content creation. The decision to adopt such a tool is, therefore, not just about a single project's aesthetics; it's about enhancing your overall communication infrastructure for better, more effective outcomes.
Ultimately, the power of this toolkit lies in its marriage of form and function. The bright, energetic color palette captures attention, while the well-drawn, precise illustration structures organize thought. By applying it with deliberate strategy—aligning each chart with a clear goal, planning its integration from the start, and avoiding arbitrary decoration—you transform data into insight and complexity into clarity. This is how visual tools move beyond mere assets and become partners in achieving your strategic communication objectives.